In 2018, I was working at the French maritime affairs, part of the Ministry of Ecology. France has the second largest sea territory in the world. It carries out 13,000 missions / year, saving ~5,600 people and assisting 14,500 more people. Sea search and rescue as well as assistance missions led to the engagement of 10,500 vessels and 1,500 helicopters or planes.
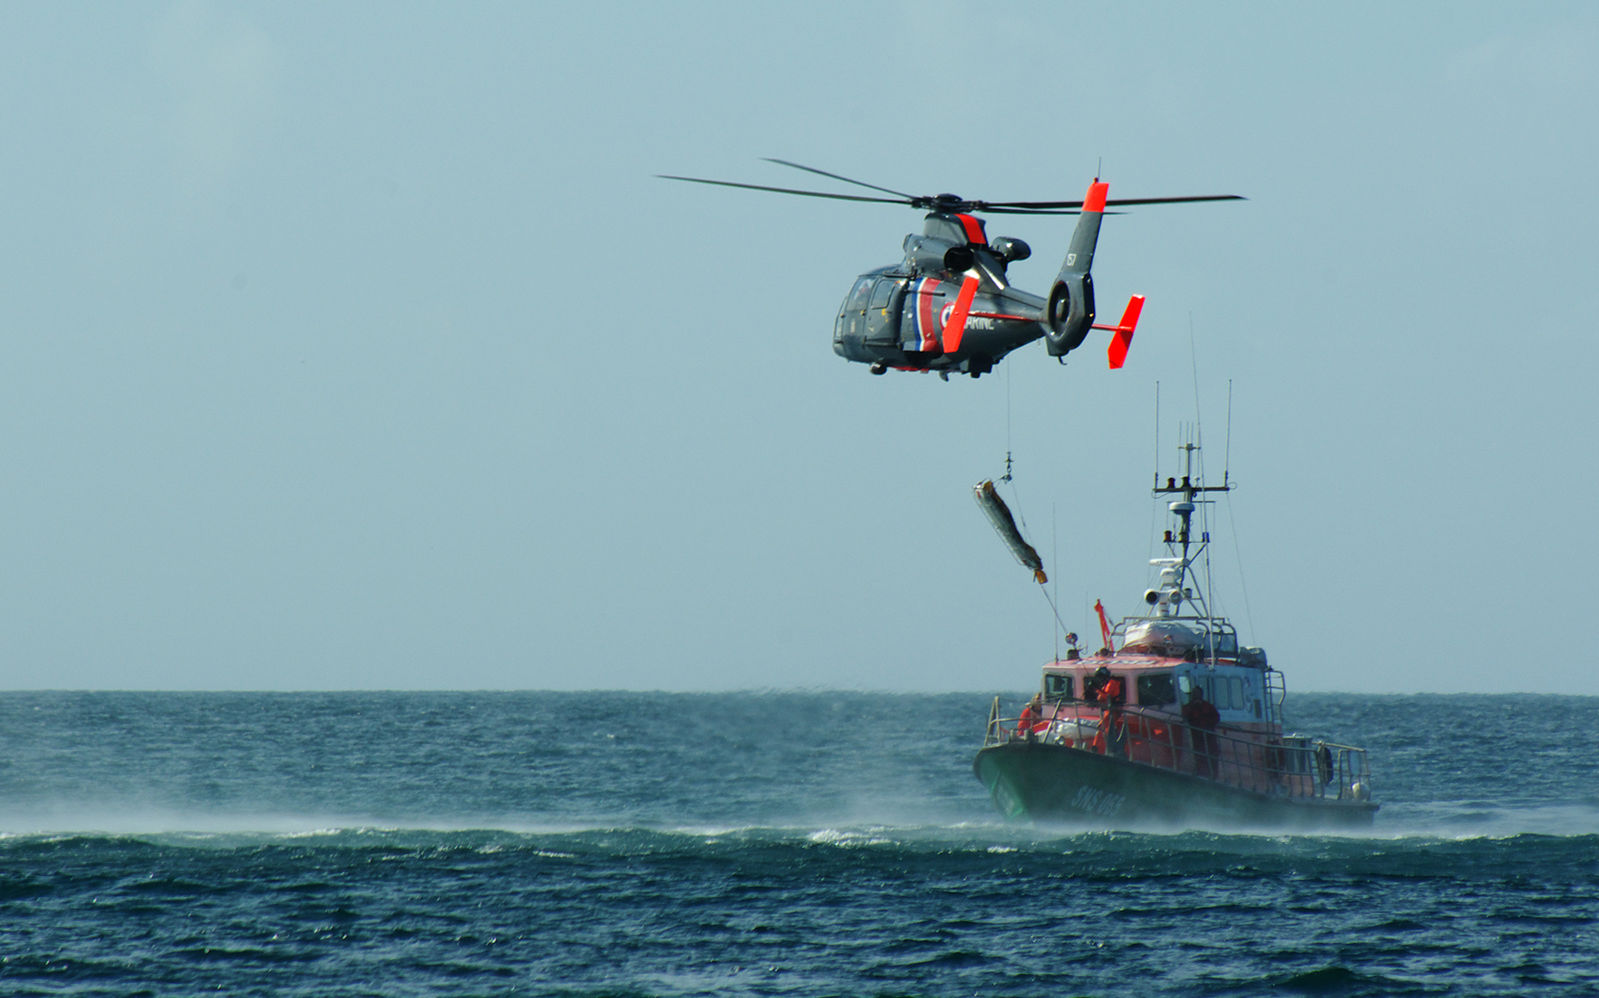
The SNSM (national society for sea rescue) and Marine Nationale out at sea
One of our goals was to improve knowledge and the collaboration among the numerous actors involved in the sea rescue process. One of the first proposition to achieve that goal was to open the sea search and rescue data. The goal was to make raw data for everyone to use, without constraints. We published more than 250,000 sea rescue operations carried out since 1985 in July 2018 on the French’s official open data platform, data.gouv.fr.
To me this dataset can be considered a “high quality open dataset”. I will now explain in further details how it was made.
Raw data
Even on a politically sensitive subject like sea rescue, we chose to publish raw data about the alert, ships involved, weather details, precise localisation, ships, vehicles or helicopters engaged, as well as what happened to the various people involved. One row per operation, in 4 tables, totalling 120 columns. It gives enough information, even for professionals and agencies, while taking into account national security and data privacy.
Designing for reusers
The original database schema was made of close to 30 tables. Acquiring the data from various actors involved in sea rescue was challenging because of the differences in technical vocabularies. We needed to build a simple schema to merge the information that everyone could easily understand
We ended up with just 4 tables, without loosing crucial information. Out of the 4 tables, 3 are raw data, as filled by agents during and after operations. The last table uses data already available in other tables and makes it more convenient to use: we perform common aggregates, filters or add convenience columns: splitting dates, converting units, adding bank holidays, sunset times etc.
As publishers, we used this dataset a lot for our own analysis. The same dataset is used internally to prepare reports, investigate new regulations and prepare prevention actions. We matured the documentation and schema by training people to perform queries on this dataset. People asked clarifications, suggested new columns or reported unclear documentation. Working in close collaboration with the sea rescue experts helped us a lot to improve the dataset quality.
Open source processes
Our data is made available online, with an open licence in the end. But what about the code written for extraction and transformation? We thought it was important to make this code open source, so that people can see how we build the dataset, can report bugs or suggest improvements. The code is published on GitHub. We benefited from this choice: people got in touch with us through this medium and knowing it was made available publicly, we felt more accountable.
In this repository, we publish the code written to extract the original data from an Oracle database, transform it, add columns, join with other datasets and prepare final files, which will end on the open data platform.
Documentation
Good open data comes up with a documentation. Right? We tried to follow this principle and went a bit further. In the web documentation, we explained how sea rescue works in France, how people are asked to fill forms when the situation is unclear, changes to the dataset are linked to the relevant code commits, schemas, tables, unique values in key columns, sample queries etc.
We felt all these pages were important and useful to deal with the complexity of the data, reflecting the reality of sea rescue operations.

UML schema describing how tables fit together
Software engineering and open data
We tried to use modern software engineering practices for our open data principles. For us, it means: version control, pull-requests with reviews, tests, pipelines, monitoring, continuous integration, data quality checks. For example, tests make it impossible to have an extra column without documentation or without an end-to-end extraction/transformation test in place. Before publishing new data, we also perform general quality tests to prevent serious regressions.
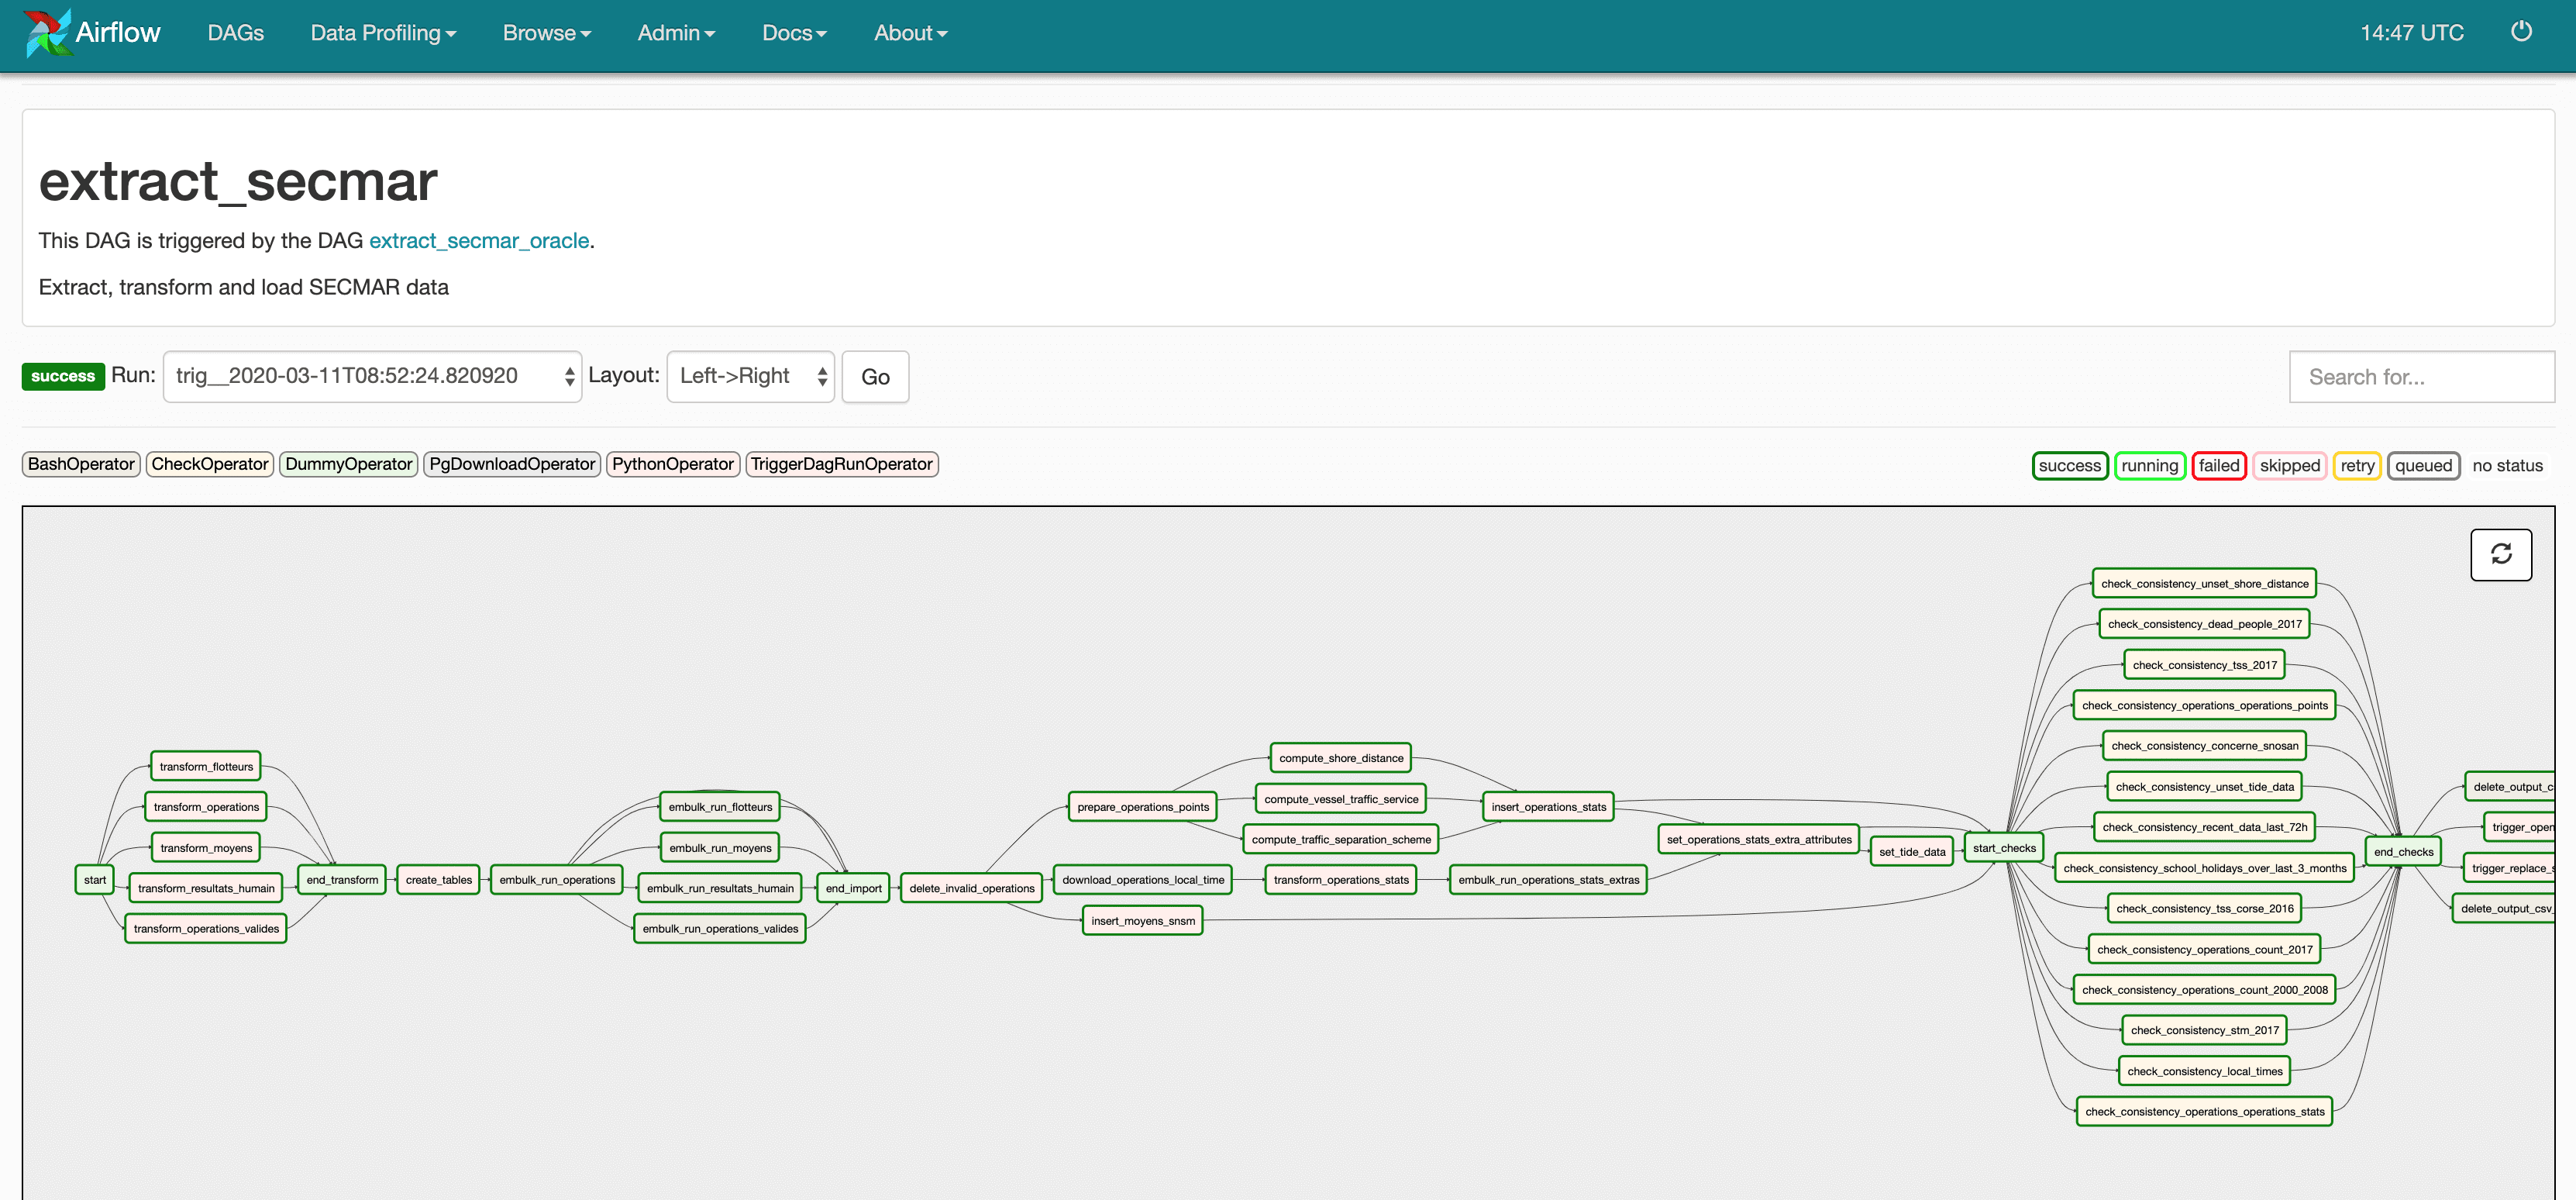
One of the transformation pipelines, using Apache Airflow
Thanks to this, we are able to publish with confidence this dataset daily, just the day after a mission happened.
We believe it is quite unique to publish an accidentology open dataset on a daily basis, without human interaction needed, at a country level.
Interactive map
Not everyone is comfortable using CSV files with hundreds of thousands of lines. Most people want to apply some filters (specific operation types, people involved, date, zone) and see common stats. As sea rescue operations are geographic data, it made sense to offer an interactive map. We decided to make this interactive map available on the Internet, without restrictions.
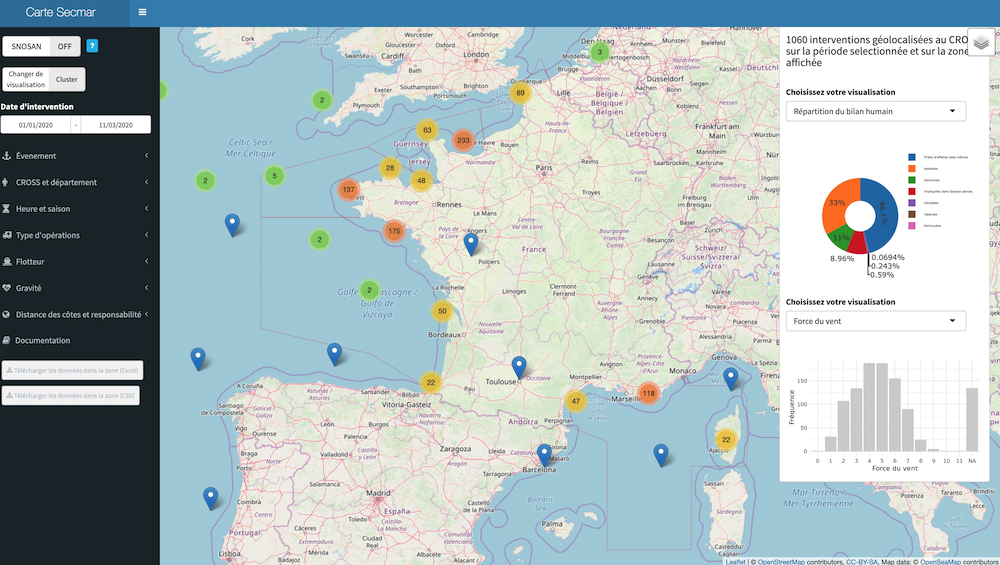
Interactive map of French sea rescue operations
It makes it much easier for people to give a quick look at the data. People can apply filters, explore and then download the unique dataset they see on their screen for further investigations.
As with the raw data, the map is open source, a documentation is available. When people export from this app, the schema is the same than the open data dataset.